Expression Correlation
Comparator-Based Plot
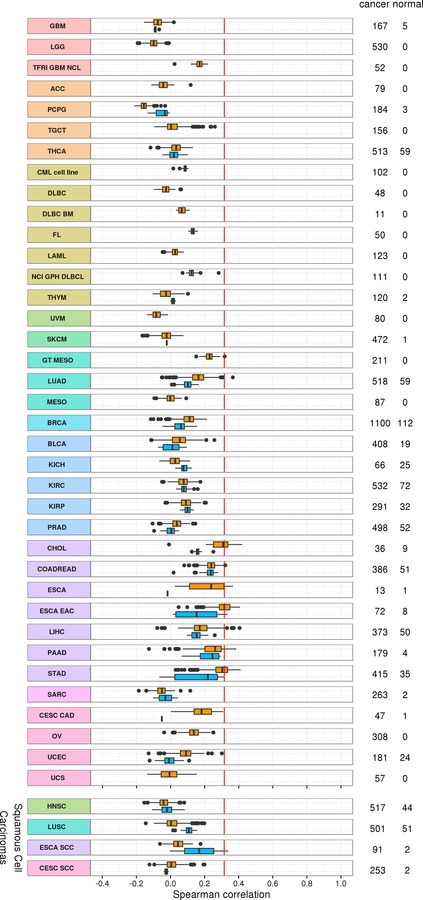
keys: expression.chart, expression.legend
Info
These will be passed to the report upload function via the images section of the JSON input
This plot represents the pairwise correlation of the RNA expression of the current sample against samples from a variety of reference distributions. Often this is used as a sanity check of the diagnosis. It is expected that the sample should correlate most highly with other samples within the disease distribution that is most closely related to the diagnosis. It is also expected that samples with a lower tumour content/purity may show correlation with their biopsy site.
An example of how this type of plot is created can be found in the scripting examples here.
Subtyping Plots
These plots are similar to the main comparator based plots but are generally smaller and include only a set of subtypes of a specific cancer type (ex. BRCA).
key: subtypePlot\.\S+
Pairwise RNA Expression Correlation
Provide a list of the most similar other samples with respect to the RNA expression profile.
{
     "pairwiseExpressionCorrelation": [
        {
            "patientId": "UPLOADPAT02",
            "library": "LIB0002",
            "correlation": 0.99,
            "tumourType": "pancreatic cancer",
            "tissueType": "liver",
            "tumourContent": 15
        }
    ]
}
All values expect the correlation are attributes of the sample being compared to and not the sample the report is being generated for
| Field | Type | Example | Description |
|---|---|---|---|
| correlation | number |
0.99 |
The RNA correlation between this sample and the report sample |
| library | string |
"LIB002" |
The library name of this sample |
| patientId | string |
"UPLOADPAT02" |
The patient ID of this sample |
| tissueType | string |
"liver" |
|
| tumourContent | number |
15 |
the tumour content or purity of this sample |
| tumourType | string |
"pancreatic cancer" |
the diagnosis of this sample |